A/B Testing
Simplest randomized controlled experiment. Comparing samples A and B that are similar except for one variation (two versions of webpage / product) – which one has a greater impact on business metrics?
Create Control Group (no change, H0) and Test Group (modified product, Ha). Avoid selection bias (random sampling), under-coverage bias (sample size).
Hypothesis Testing
Null hypothesis, H0: no difference between the control and test groups.
Alternative Hypothesis, Ha: educated guess to be verified.
3. Conduct A/B Test
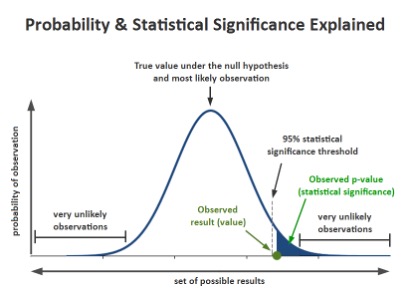
4, Statistical significance
Type I error: rejecting H0 when it is true (“You are pregnant” to a man)
Type II error: not rejecting H0 when it is false (“You are not pregnant” to pregn. woman)
 |
|
To avoid ‘ errors – we have 2 samples => determine statistical significance using two-sample t-test.
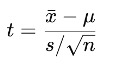
One-sample t test: compare mean of one sample w/hypothesized population mean.
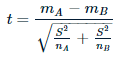
Two-sample t test: compare means of two samples.
Independent Samples t-test: compare means of two independent groups.
Paired Sample t-test: compare separate means for one group at two different times.
t-statistic = how much sample’s data diverges from H0. xˉ - sample mean, μ - population mean under H0, s - sample’s st_dev, n = sample size. Denominator = also known as standard error. |
one-sample test two-sample test |
  |
p-value - proba of obtaining test statistic at least as extreme as observed, assuming H0 is true
First, t-statistic is computed from the sample data, then p-value is derived from t-statistic using the t-distribution (similar to normal distribution, but with heavier tails - more prone to producing values). Interpretation: larger absolute t-statistic = greater deviation from H0 and smaller p-value = stronger evidence against H0.
Python:
import scipy.stats as ss
t_stat, p_val= ss.ttest_ind(data_B, data_A)
print(t_stat, p_val)
# 1.55, 0.02 => reject H0
What Mistakes Should we Avoid While Conducting A/B Testing?
There are a few key mistakes I’ve seen data science professionals making. Let me clarify them for you here:
Invalid hypothesis: The whole experiment depends on one thing i.e the hypothesis. What should be changed? Why should it be changed, what the expected outcome is, and so on? If you start with the wrong hypothesis, the probability of the test succeeding, decreases
Testing too Many Elements Together: Industry experts caution against running too many tests at the same time. Testing too many elements together makes it difficult to pinpoint which element influenced the success or failure. Thus, prioritization of tests is indispensable for successful A/B testing
Ignoring Statistical Significance: It doesn’t matter what you feel about the test. Irrespective of everything, whether the test succeeds or fails, allow it to run through its entire course so that it reaches its statistical significance
Not considering the external factor: Tests should be run in comparable periods to produce meaningful results. For example, it is unfair to compare website traffic on the days when it gets the highest traffic to the days when it witnesses the lowest traffic because of external factors such as sale or holidays
When Should We Use A/B Testing?
A/B testing works best when testing incremental changes (UX changes, new features, ranking, and page load times - compare pre and post-modification results).
A/B testing doesn’t work well when testing major changes, like new products, new branding, or completely new user experiences. In these cases, there may be effects that drive higher than normal engagement or emotional responses that may cause users to behave in a different manner.
More here:
Additional hypothesis tests (notebook downloaded): https://towardsdatascience.com/a-b-testing-a-complete-guide-to-statistical-testing-e3f1db140499
Statistics for Analytics and Data Science: Hypothesis Testing and Z-Test vs. T-Test